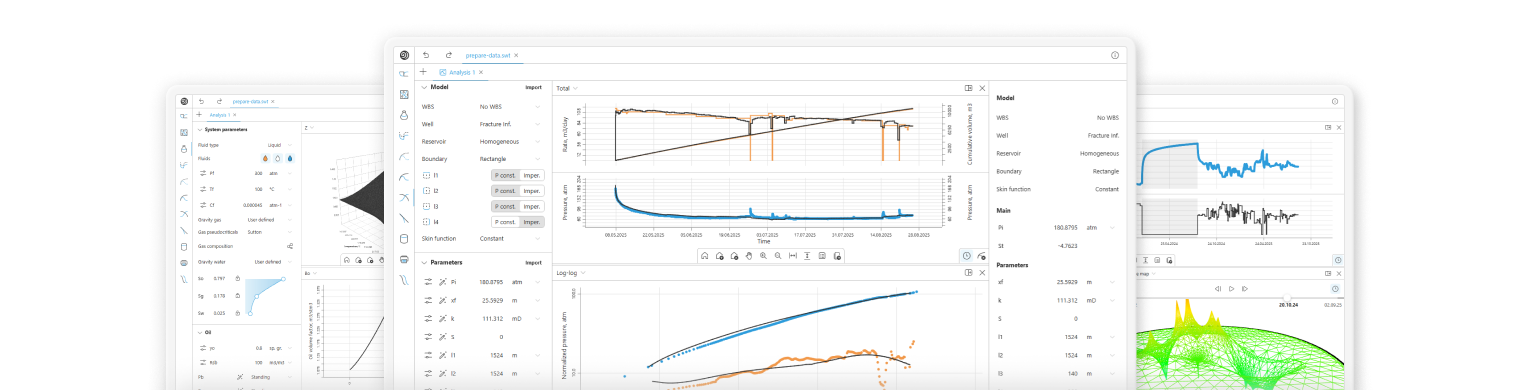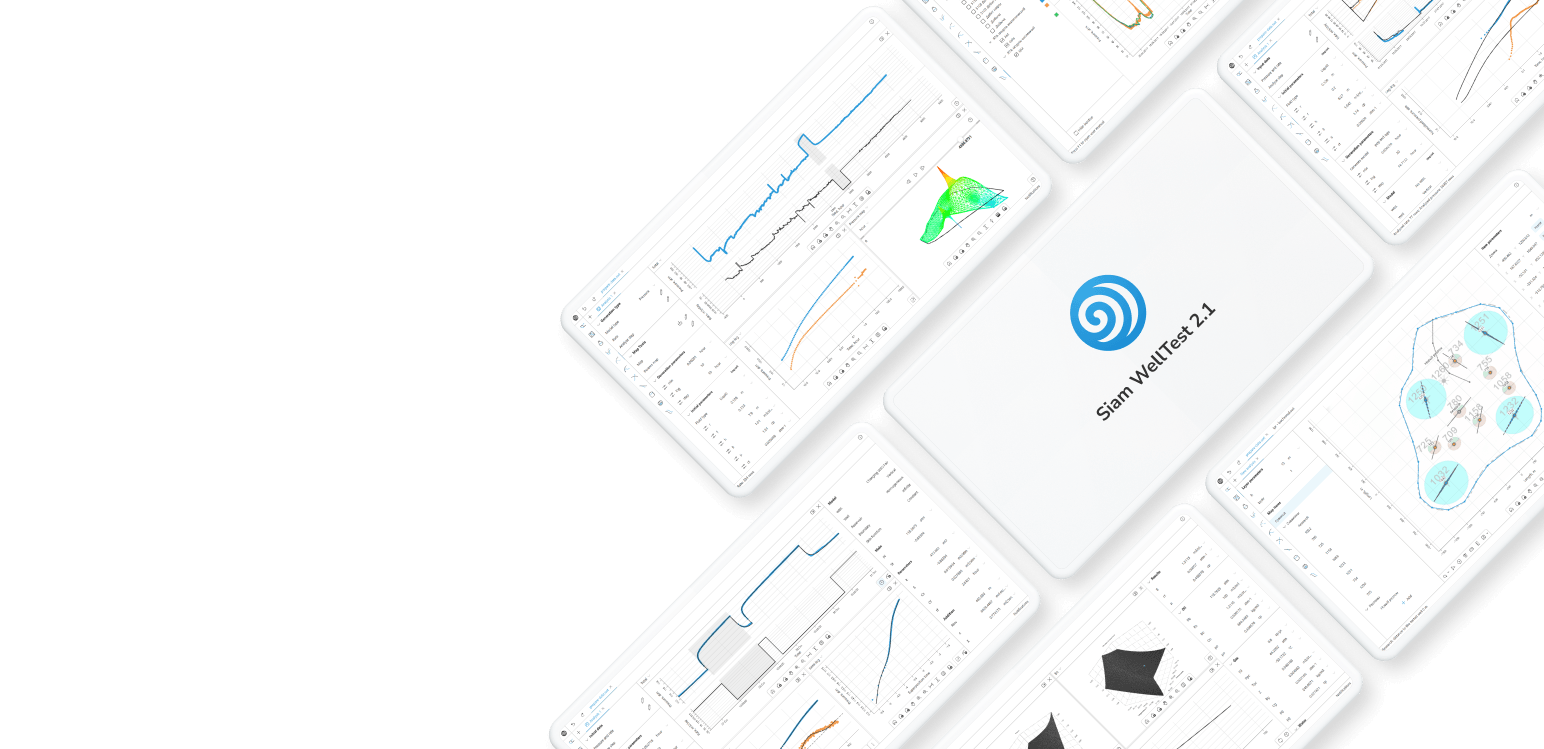
Siam WellTest 2.1.
Software suite for hydrodynamic and gas-dynamic well test analysis and interpretation
Purpose
Purpose of the software suite
Analysis and digitizing of pressure and rate data from gauges
Interpretation of well tests (PTA)
Production analysis and forecasting from operating data (RTA)
Refining reservoir structure and assessing well interference
What you get
Parameters obtained
High calculation accuracy based on analytical and numerical models.
Reservoir pressure and energy potential
(Piinitial reservoir pressure, Pavgaverage reservoir pressure, Pwfbottomhole flowing pressure, dPdrawdown, Psatsaturation pressure, Jproductivity index, AOFabsolute open flow potential)Flow-capacitance reservoir properties
(kpermeability, khflow capacity, ηdiffusivity, kz/krpermeability anisotropy, ωstorativity ratio, λinterporosity flow coefficient, Ricomposite zone radius, Mmobility ratio, Ddiffusivity coefficient)Well characteristics, wellbore and hydraulic fracture geometry
(Cswellbore storage coefficient, Xffracture half-length, Fcfracture conductivity, Lwwellbore length, Nfnumber of fracturing stages, θfracture orientation angle, hwperforated interval thickness, zwvertical well offset, αwellbore azimuth, βwellbore deviation angle)Assessment of near-wellbore zone condition
(Stotal skin factor, Smmechanical skin factor, Sggeometric skin factor, Saanisotropic skin factor, Dnon-Darcy flow coefficient, Alinear flow coefficient, Bnon-linear flow coefficient)Presence and distance to boundaries and faults
(Ldistance to boundary, Rinvradius of investigation, Redrainage radius)Features
Key product features
Fast calculations
Mathematical calculations are optimized for fast and comfortable work with data
Flexible configuration
Supports standalone operation or connection to a remote compute server.
Modular structure
The application configuration is assembled individually to the customer's requirements
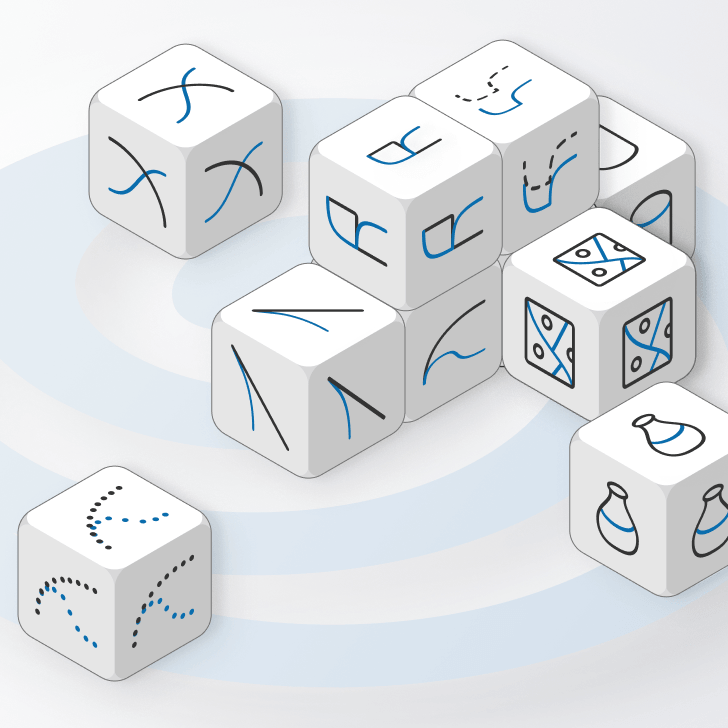

Interactive interface
Simple and convenient tools for user interaction with the interface
Cross-platform
Full functionality on Windows, Linux, and macOS.
Structure
Modular structure
SiamWellTest is built on independent modules that can be flexibly combined for a specific customer's tasks. You get exactly the toolset you need — nothing extra.

Data preparation module
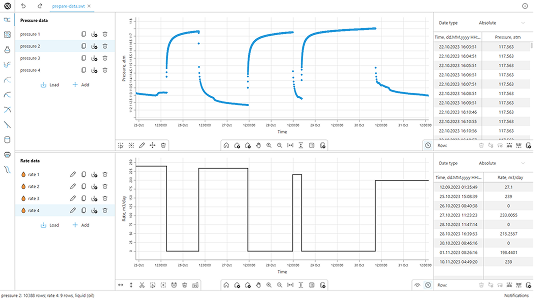
Data Preparation Module
Loading and editing of pressure and rate data with interactive work on charts and in tables.
- Sources: text files, Excel, clipboard, images
- Unlimited number of series on a common time axis
- Multiphase flow rate with total computed from phase components
- Interactive tools: synchronization, splitting, merging, scaling
- Tabular time input as absolute values, relative values, or steps

PVT module
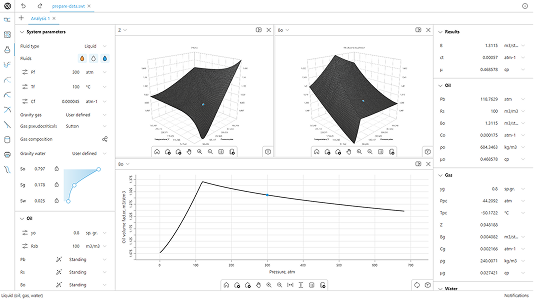
Calculation of reservoir fluid properties with an interactive model and instant response during parameter tuning.
- Fluids: oil, water, gas, condensate in arbitrary combinations
- Detailed gas composition setup with pseudo-critical properties calculation
- Wide selection of built-in correlations for fluid properties
- Loading of external correlations as discrete values with interpolation
- Correlation matching to measured data via optimization
- 2D and 3D visualization of multi-parameter dependencies

Pressure recalculation module
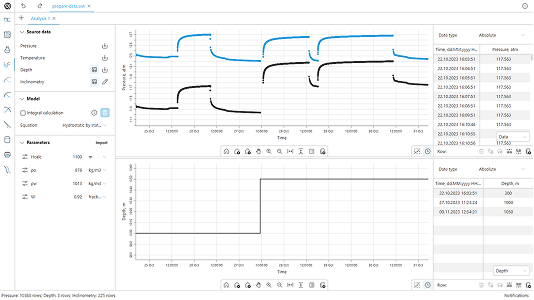
Referring pressure to the required depth for oil and gas wells with a flexible set of physical assumptions.
- Conversion from a downhole gauge, static or dynamic fluid level
- Accounting for well deviation, friction, variable depth, and temperature
- Linear and integral calculation algorithms
- Wide range of conversion models by well type and measurement conditions
- Friction models from a constant coefficient to pipe roughness-based calculations

Generation module
Test design and generation of synthetic pressures or rates based on analytical and numerical models.
- Pressure generation from production history or rate generation from bottomhole pressure history
- Modeling of complex well production history via superposition or numerical models
- Variable skin factor: rate-dependent function or manually defined intervals
- Well interference from offset wells taken directly from an interactive map
- Point density settings: linear, logarithmic, or mixed
- Dynamic pressure fields with frame-by-frame playback and animation

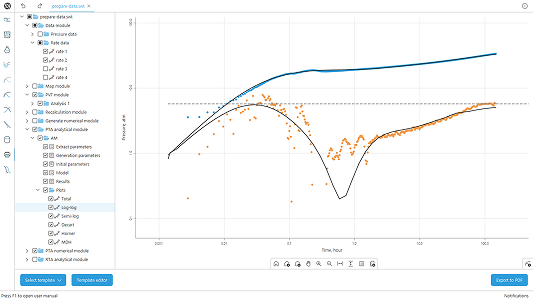
PTA module
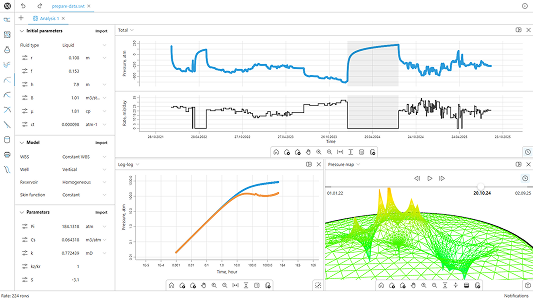
Interpretation of transient well tests for oil and gas wells with a broad set of tools.
- Diagnostic plots: log-log with derivative, semi-log, Horner, MDH, and others
- Data decimation and smoothing for high-quality derivative calculation
- Automated model matching: optimization points and search bounds for target parameters
- Well interference through the well map with instant recalculation
- Variable skin factor: rate-dependent function or interval-based specification in time
- Post-processing: average reservoir pressure and phase permeabilities

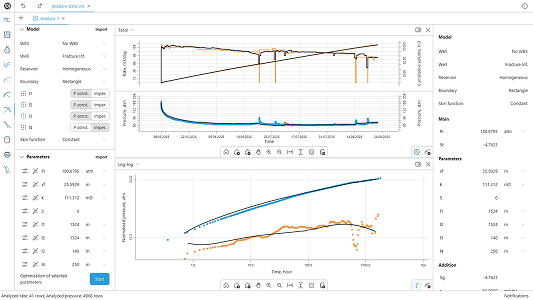
RTA module
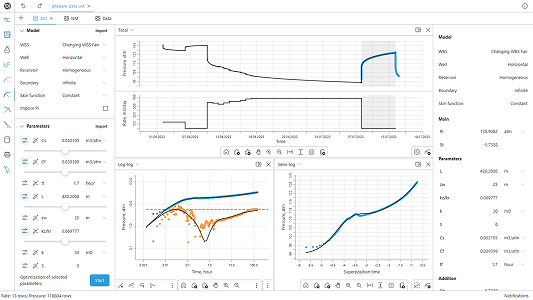
Analysis of long production histories through analytical and numerical modeling.
- Comprehensive well history plot: rates, cumulative production, pressure measurements
- Diagnostic plot of rate-normalized pressure and its derivative
- Automated model matching to field data with configurable parameter bounds
- Modeling of complex well production history via superposition or numerical models
- Well interference from offset wells through an interactive map
- Production forecast from a given pressure, or pressure forecast from a given production

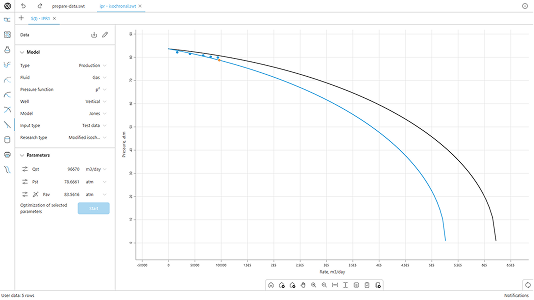
IPR module (inflow performance)
Analysis of inflow performance curves for oil and gas wells with a wide selection of models and processing methods.
- Calculations for oil and gas wells
- Extended analysis methods: flow-after-flow, isochronal, modified isochronal
- Non-Darcy flow effects, including turbulent flow
- Automated model matching to IPR curve points
- Support for vertical wells, horizontal wells, and wells with a fracture
- Interactive model setup with instant response to input

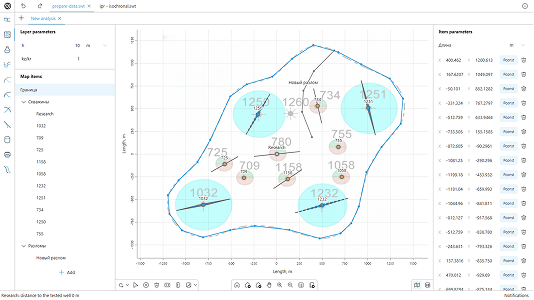
Maps module
Preparation of well and reservoir data within the study area for subsequent interference analysis.
- Background image loading with adjustable transparency as a template for map construction
- Multiple object types: wells of various geometries, geological boundaries, faults
- Two ways to define objects: visually on the map or by precise coordinate input
- Dedicated interface for loading and time-matching well production histories
- Interactive scaling and distance measurement between objects

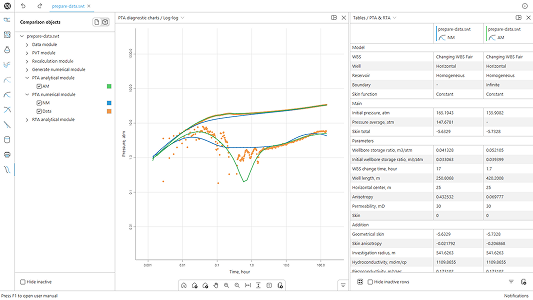
Comparison module
Graphical and tabular comparison of data and analysis results from all modules of the system.
- Full set of industry plots: pressure, rate, log-log, IPR, and others
- Flexible control of data series, axes, and interactive legend
- Tabular comparison of analyses with configurable displayed fields and groupings
- Export of graphical and tabular information

Reports module
Export of textual and graphical information from any calculation module as a formatted PDF document.
- Unified export interface across all modules of the system
- Detailed configuration of exported content
- Pre-export graphics adjustment
- Saving and reusing report templates
- Final output in PDF format
Mathematics
Mathematical models
An extensive library of analytical and numerical models — choose the optimal solution for any task and reservoir complexity.
Gas relative density correlations
- By gas composition
- Wet gas
Gas pseudocritical properties correlations
- By gas composition
- Condensate
- Sutton
- Standing
- Carr et al.
Gas
- Z: Dranchuk, Hall-Yarborough, Standing, Dranchuk-Abou Kassem
- C: Dranchuk
- μ: Lee et al., Carr et al.
Oil
- Pb and Rs: Standing, Vasquez-Beggs, Glaso volatile, Glaso non volatile, Petrosky-Farshad
- B: Standing, Vasquez-Beggs, Glaso, Petrosky-Farshad
- C: Vasquez-Beggs, Petrosky-Farshad
- μ: Beggs-Robinson, Beal, Glaso, Andrade, Petrosky
Water
- Rs: McCain, McCoy
- B: Meehan-Ramey
- C: Osif
- μ: Van Wingen-Frick, Helmoltz-Frick
Condensate
- Gas-liquid ratio (rs): Kleyweg
- Compressibility factor (Cg): Dranchuk
Calculation models
- Hydrostatics for downhole gauge recalculation
- Hydrostatics for dynamic fluid level
- Hydrostatics for static fluid level
- Hydrostatics for static level accounting for dynamic level
- Barometric formula for gas wells
- Hasan-Kabir method
- Modified Hasan-Kabir method
Friction models
- No friction
- Constant (constant hydraulic resistance coefficient)
- Smooth pipes (Poiseuille formula + Blasius formula)
- Rough pipes (Churchill formula)
Wells
- Vertical
- Uniform-flux fracture
- Infinite-conductivity fracture
- Finite-conductivity fracture
- Partial penetration
- Horizontal
- Horizontal with multi-stage fracturing
Boundaries
- Single fault
- Channel
- Intersecting faults
- Bounded channel
- Rectangle
- Circle
- Interference
Wellbore storage
- Constant
- Hegeman
- Fair
Reservoirs
- Homogeneous
- Dual porosity
- Radially composite
- Linearly composite
Wells
- Vertical
- Infinite-conductivity fracture
- Finite-conductivity fracture
- Partial penetration
- Slanted
- Horizontal
Boundaries and faults
- No-flow boundary
- Constant-pressure boundary
- Sealing faults
- Faults of limited conductivity
Wellbore storage
- Constant
- Hegeman
- Fair
Reservoirs
- Homogeneous
- Dual porosity
Property maps
- permeability
- porosity
IPR curve models
- Custom
- Vogel
- Transient
- Pseudo-steady-state
- Fetkovich
- Jones
- Joshi
- Renard
- Borisov
- Giger
- Vlis
- Badu and Odeh
Test type
- Flow-after-flow method
- Isochronal method
- Modified isochronal method
Well type
- Vertical
- Fractured
- Horizontal
Fluid type
- Liquid
- Gas
New in version 2.1
Numerical modeling
Modeling of complex heterogeneous reservoirs, arbitrary geometry, and multi-fractured horizontal well systems with high calculation detail.
High-speed solver
Optimized algorithms ensure high calculation speed even for large, complex numerical models.

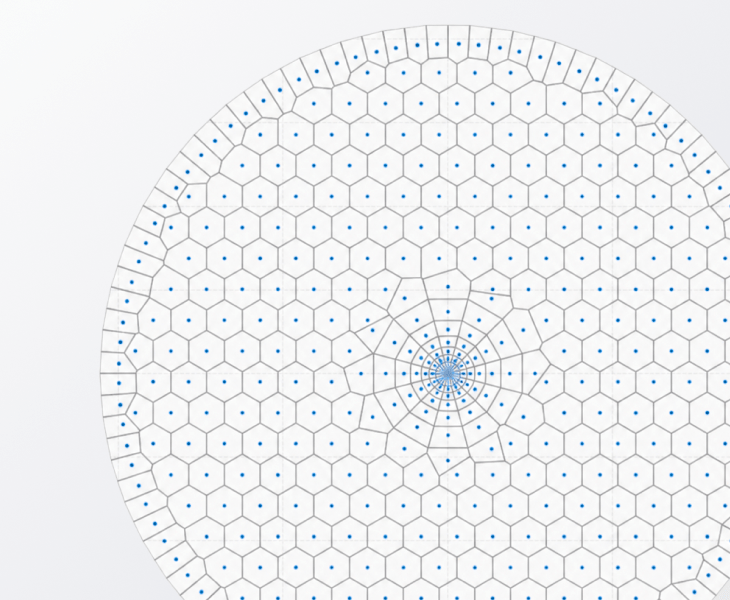
Adaptive Voronoi grid
Automatic grid refinement in well and fracture zones. Ensures maximum accuracy in key areas and reduces calculation time without sacrificing quality.
Arbitrary reservoir geometry
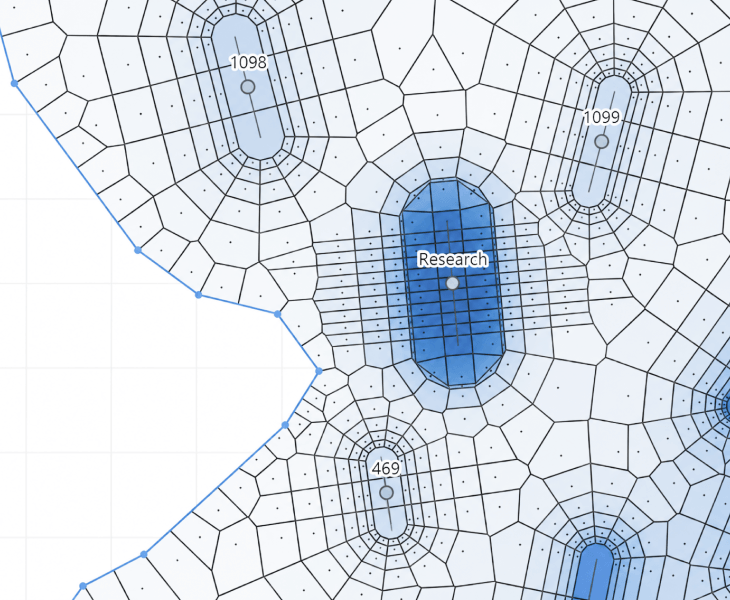
Accounts for the actual reservoir shape, complex fault structure, property maps, and multi-fractured horizontal well systems — the model is built for specific geological conditions.
Dynamic visualization
Clear display of pressure fields in animated mode. Step-by-step analysis of pressure change and propagation in the reservoir, right in the interface.

Usability and infrastructure
Platform functional features
A well-thought-out application infrastructure that makes work fast and predictable — from data import to the final report.
Flexible build and configuration
Choose the module set you need and configure the app for your team's workflow.
Unified data space
Cross-module access to information is provided through a built-in data import and exchange system.
Working with files and projects
Save, open, and manage projects with full preservation of model and calculation state.
Charts and visualization
Interactive charts with flexible display settings, digitizing support, and export.
Action control
Multi-level undo for any operation, protecting against accidental mistakes.
Notification system
A unified message stack that logs all background processes, automatic changes, and system events.
Units of measurement
On-the-fly unit switching in fields and charts, unit selection during data loading, and saved default settings.
Interactive help
A detailed reference system for using the app's functions and tools, right inside the interface.

Build
Build options
Standalone application
Local installation on a workstation with no internet connection required. All calculations run on the user's workstation. Licensing is via a physical USB dongle or a digital license.

Client + local license server
A license server is installed on the customer's corporate network. Calculations run locally on users' PCs, while the number of concurrent seats is controlled by a central hardware key on the server.

Client + subscription
A client application connecting over the internet to our compute server on a subscription basis. All resource-intensive calculations run on the server, requiring no powerful PC or physical keys.

Integration
Integration with corporate databases
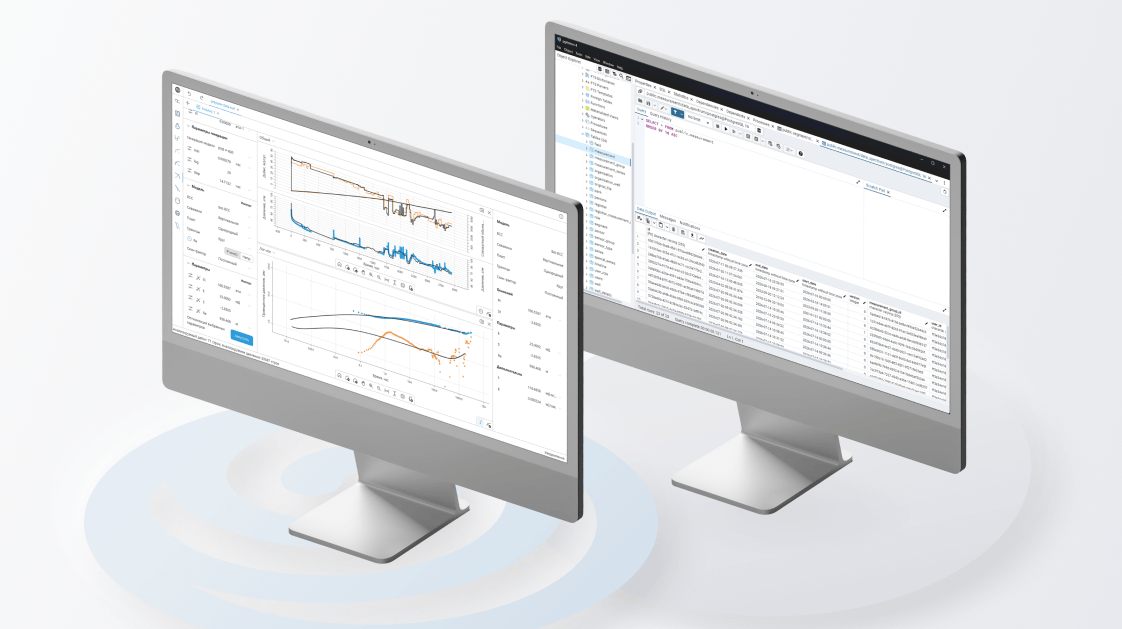
The platform ships with ready-made integration with the SIAM OS database. On customer request, we develop custom integration modules for any corporate storage systems and software.
We tailor this to your needs:
- Integration with any type of corporate database or software
- Automatic export of analysis results to target systems
- Generation and export of graphical and tabular materials per your company's standards
Ready to try it?
Request a personal demonstration of the platform or contact us to run a pilot project on your data.